
The plug-in collects and processes data recorded by monitoring the API execution and converts it into readable form by arranging it into metrics and the metric data is by default sent to CloudWatch at an interval of one minute.
Risk Level: Low
Description:
The plug-in collects and processes data recorded by monitoring the API execution and converts it into readable form by arranging it into metrics and the metric data is by default sent to CloudWatch at an interval of one minute. CloudWatch works at a more granular level to detect errors, monitor API stages caching and latency.
About the Service:
API(Application Programming Interface) Gateway is an AWS service that lies between the client and tons of backend services. The actions performed by API Gateways include creating, deploying, and managing RESTful API and WebSocket API.
Impact:
The drawback of missing detailed CloudWatch metrics is the inability to act fast and take immediate actions based on information delivered by these matrices through alarms which means the latency is increased.
Steps to reproduce :
- Sign-in to AWS management console.
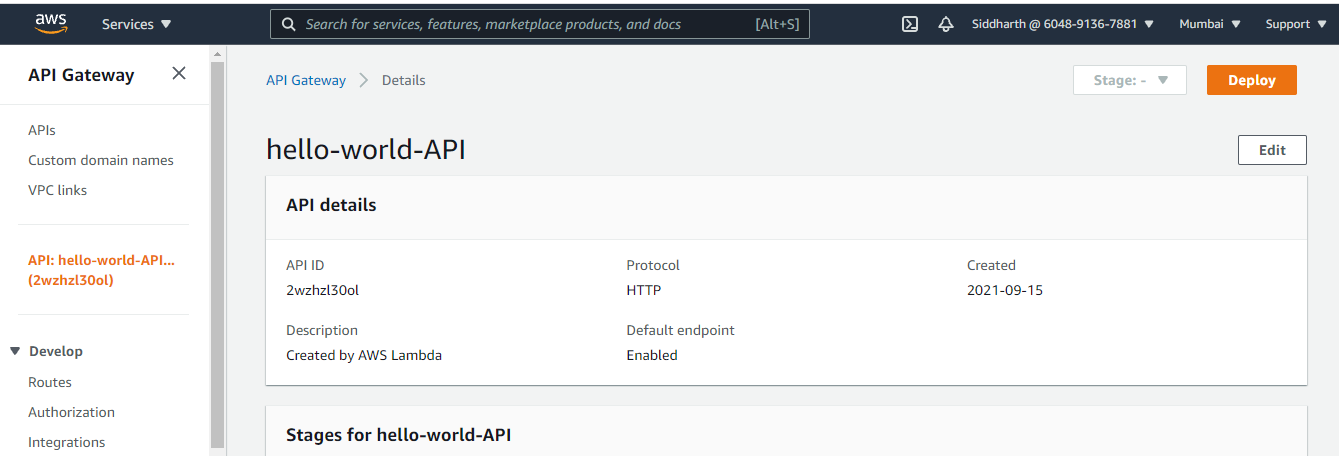
- Navigate to API Gateway dashboard at https://console.aws.amazon.com/apigateway/
- Open the API listing page by selecting APIs, present in the left navigation panel.
- Choose the API you want to examine.
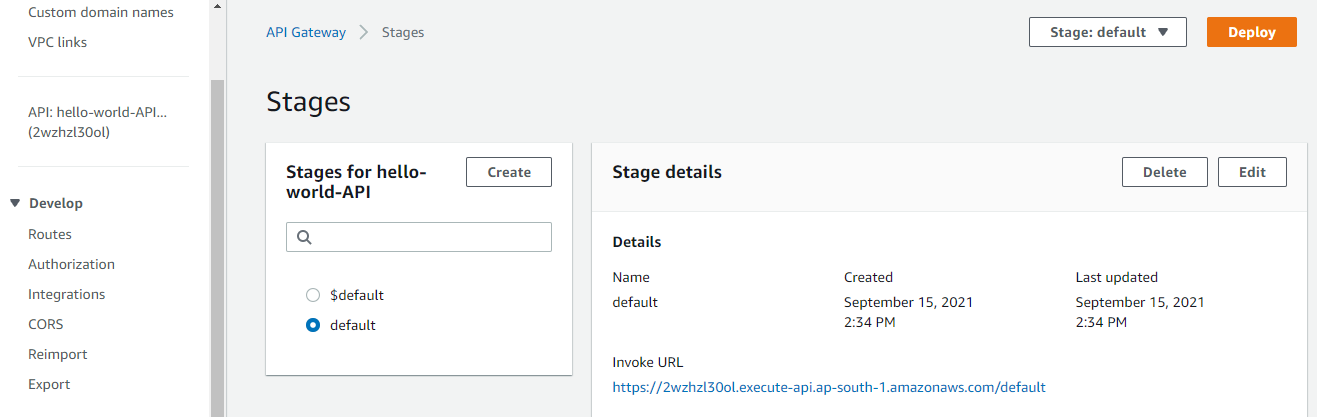
- Select Stages to list the created staged for the selected API, in the API submenu.
- Select the stage you want to examine.
- Open Stage configuration settings, in the Logs tab, on the API stage editor panel.
- Verify the Enable Detailed CloudWatch Metrics Setting status.
Steps for remediation :
- Sign-in to AWS management console.
- Navigate to API Gateway dashboard at https://console.aws.amazon.com/apigateway/
- Open the API listing page by selecting APIs, present in the left navigation panel.
- Choose the API you want to examine.
- Select Stages to list the created staged for the selected API, in the API submenu.
- Select the stage you want to examine.
- Open Stage configuration settings, in the Logs tab, on the API stage editor panel.
- Enable the Enable Detailed CloudWatch Metrics Setting by checking the checkbox.
- Once the changes are saved , following metrics will be generated by each API method:
- API calls
- Latency
- Integration Latency
- 4xx and 5xx errors
References:
- https://docs.aws.amazon.com/apigateway/latest/developerguide/http-api-metrics.html
- https://www.pulumi.com/docs/guides/crosswalk/aws/cloudwatch/