
- Knowledge Base
- Azure Knowledge Base
- Azure Monitor
-
AWS Knowledge Base
- Amazon EKS
- Amazon RDS
- Amazon Kinesis
- AWS Organizations
- Amazon SQS (Simple Queue Service)
- AWS Cloudtrail
- AWS Certificate Manager
- AWS IAM
- AWS Workspaces
- Amazon S3
- AWS Systems Manager (AWS SSM)
- Amazon EC2
- Amazon Redshift
- Amazon EMR
- Amazon CloudFront
- Amazon DynamoDB
- Amazon Managed Workflows for Apache Airflow (MWAA)
- Amazon Route 53
- AWS Key Management Service (KMS)
- Amazon CloudWatch
- Amazon ElasticSearch
- AWS Database Migration Service
- AWS Config
- AWS X-Ray
- Amazon API Gateway
- Amazon Athena
- Amazon SageMaker
- AWS Elastic Load Balancing (ELB)
- AWS Lambda
- AWS Auto Scaling
- Amazon GuardDuty
- Amazon Elastic File System (Amazon EFS)
- Amazon Elastic Container Registry (Amazon ECR)
- AWS Glue
- Amazon Simple Notification Service (SNS)
- AWS Elastic Beanstalk
- AWS CodeBuild
- AWS Secrets Manager
- AWS Transfer Family
- Amazon Access Analyzer
-
Azure Knowledge Base
- Container Registries
- Azure Virtual Machines
- Network Security Group
- PostgreSQL
- Azure Monitor
- Azure Security Center
- SQL Databases
- SQL Servers
- Storage Accounts
- Azure Key Vaults
- Load Balancers
- App Services
- Azure Active Directory
- Activity Log
- Azure Policy
- Kubernetes Services
- Azure Resources
- Azure Cosmos DB
- CDN Profiles
- MySQL Servers
- Azure Virtual Network
- Azure Network Watcher
- Azure Cache for Redis
-
GCP Knowledge Base
- Google Cloud VPC
- Google Cloud IAM
- Google Cloud Load Balancing
- Google Cloud Logging
- Google Cloud Kubernetes Engine
- Google Cloud Pub/Sub
- Google Compute Engine
- Google Cloud Key Management Service (KMS)
- Google Cloud DNS
- Google Cloud Storage
- Google Cloud Dataproc
- Google Cloud SQL
- Google Cloud Spanner
- Google Cloud Deployment Manager
- Google Cloud BigQuery
- Google Cloud Dataflow
-
Digital Ocean Knowledge Base
Azure Monitor No Diagnostic Settings
Risk Level: Low
Description
The plugin checks that the Azure Monitor account is configured. This simply implies that there are diagnostic settings configured to instruct the monitor platform on what kind of data and instances needs to be archived.
About the Service
Monitor: As the name suggests Azure monitor service, allows users to view and analyze all the activities around the azure platform and on-premises environment. Through Azure Monitor, users take an insight of the applications, VMs or containers, visualize the workbooks and dashboards, analyze the Metric analytics and log analytics for issues, respond to alerts and integrate logic apps and export APIs.
Impact
In case the diagnostic setting(s) is not set, the monitor platform will not be able to take action of collecting logs of the required categories which are essential to be collected and stored for later analysis.
Steps to Reproduce
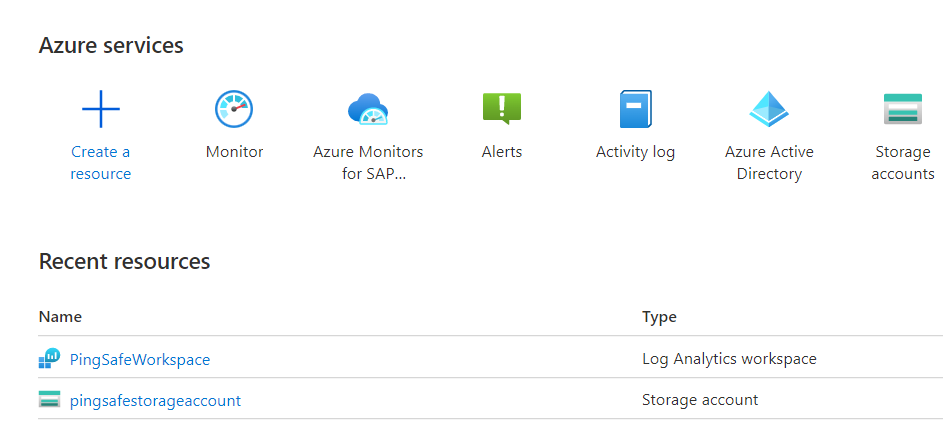
- Log in to the Azure portal.
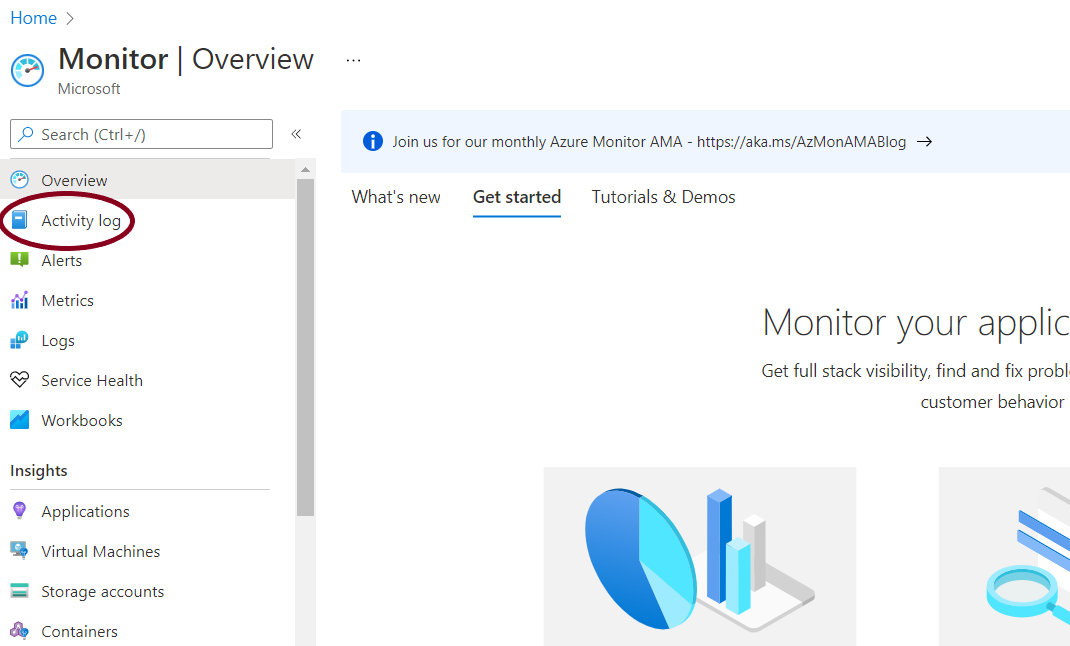
- Go to Monitor under Services or type “Monitor” in the search box.
- From the navigation panel, go to Activity log.
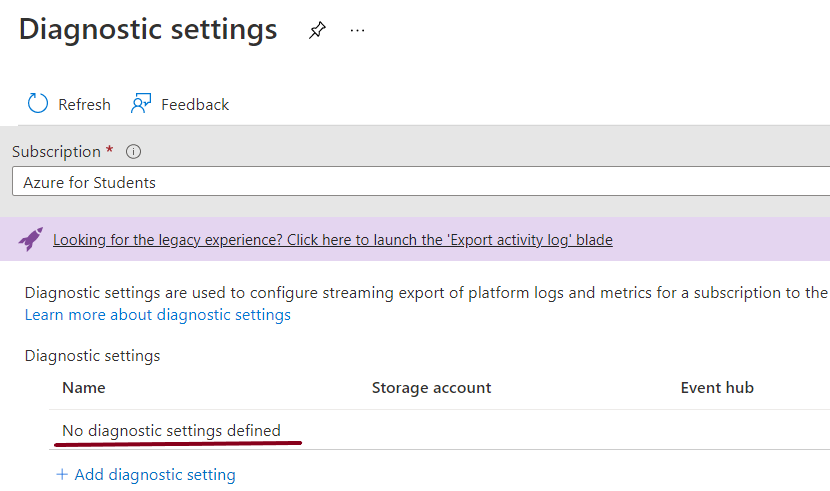
- Go to the Diagnostic tab. Verify that a diagnostic rule is present. If not, please visit the Steps to Remediate section.
Steps for Remediation
- Login to the Azure portal.
- Go to Monitor under Services or type “Monitor” in the search box.
- From the navigation panel, go to Activity log.
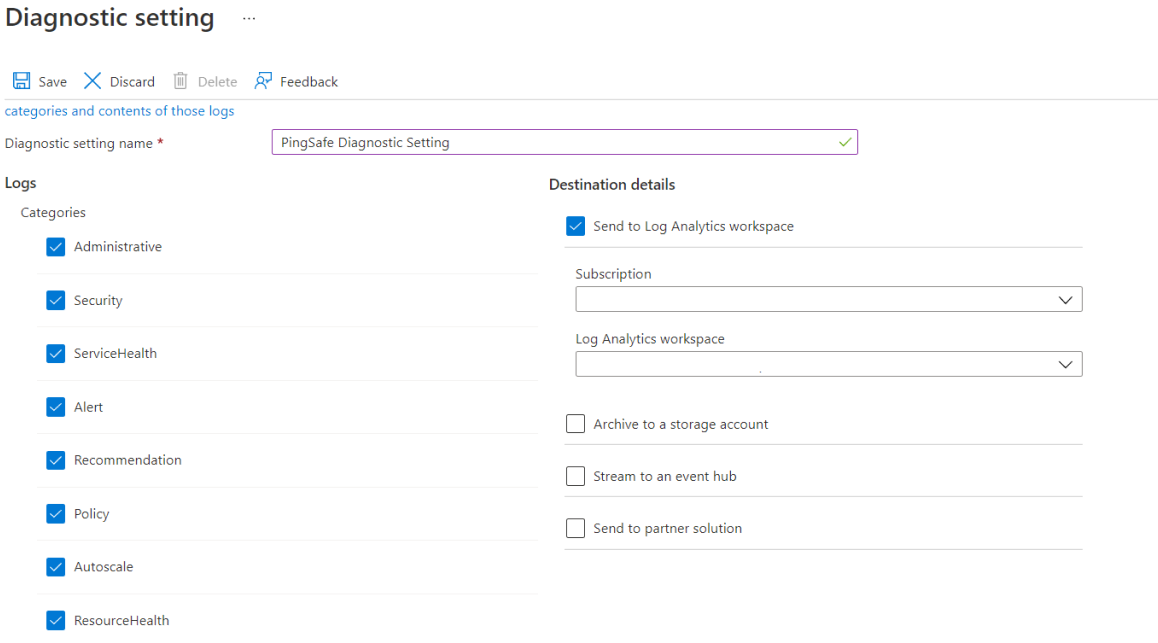
- Go to the Diagnostic tab. Click on Add diagnostic setting under Diagnostic settings.
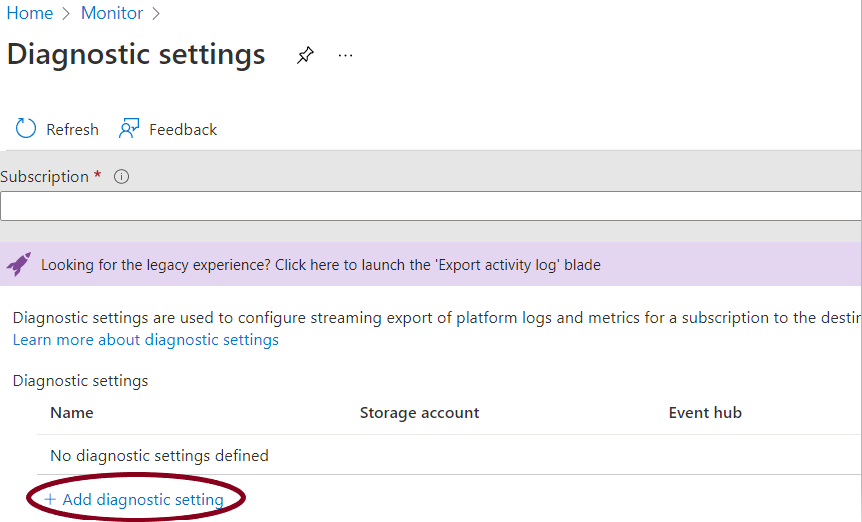
- Fill in the Diagnostic setting name field, under logs select all the categories (we recommend selecting all the categories) and select a destination field. Click on the Save button and wait for the changes to get saved.
Please feel free to reach out to support@pingsafe.ai with any questions that you may have.
Thanks
PingSafe Support