
This plugin makes sure that X-Ray tracing is enabled for AWS Lambda functions.
Risk Level: Medium
Description:
This plugin makes sure that X-Ray tracing is enabled for AWS Lambda functions. In order to have visibility into the execution and performance of AWS Lambda functions, active tracing should be enabled.
About the Service:
AWS Lambda is a serverless compute service that allows you to run code without having to provision or manage servers, create workload-aware cluster scaling logic, keep event integrations up to date, or manage runtimes. You can use Lambda to run code for almost any form of application or backend service, and you don't have to worry about managing it. Simply upload your code as a ZIP file or container image, and Lambda will automatically and precisely assign compute execution power and run your code in response to incoming requests or events, at any scale.
Impact :
AWS X-Ray can provide tracking and monitoring capabilities for your Lambda functions.
With tracing mode disabled, we won’t be able to save time and effort debugging and operating your functions as the X-Ray service support.
Furthermore, we won’t be able to rapidly diagnose errors, identify bottlenecks, slowdowns and timeouts by breaking down the latency for your Lambda functions.
Steps to reproduce :
- Sign in to your AWS console.
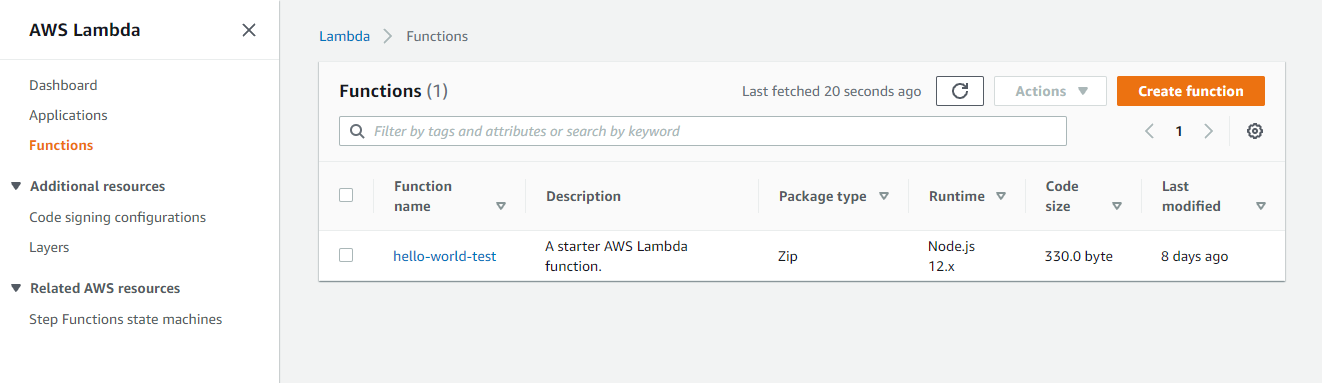
- Navigate to the Lambda dashboard at: https://console.aws.amazon.com/lambda/
- Select the Function you want to examine and visit its configuration page.
- Select the Configuration tab to view its setting panel.
- Click Monitoring and operating tools to view its settings
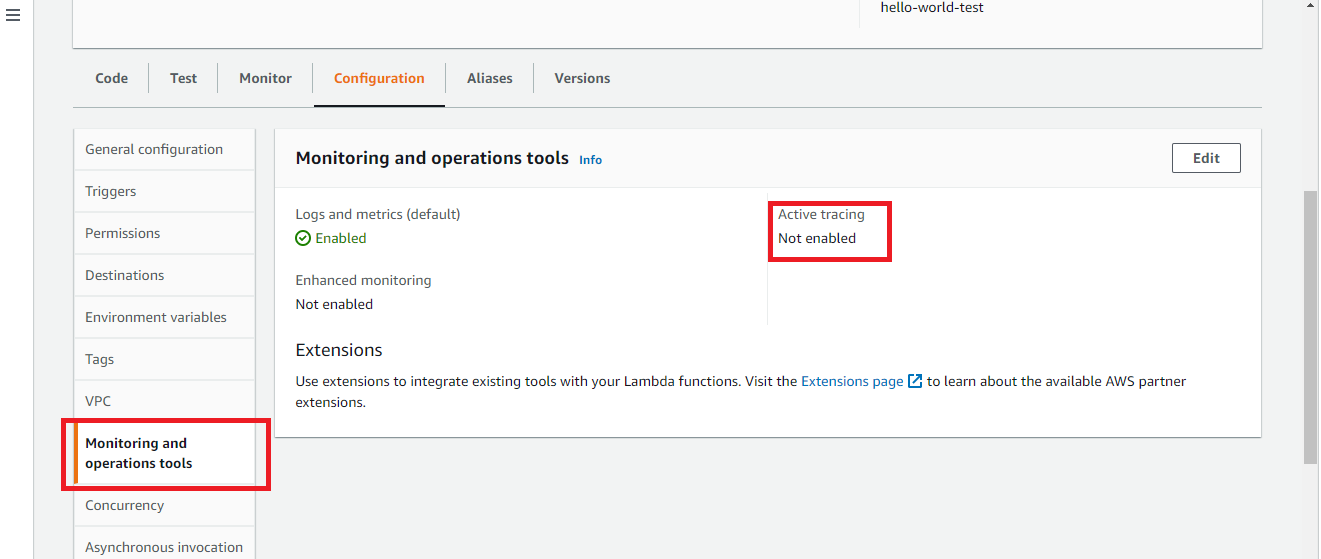
- Check the status of Enable active tracing option. If it is not checked, then AWS X-Ray support for the selected Lambda function is not enabled.
Steps for remediation :
Modify Lambda functions to activate tracing
- Sign in to your AWS console.
- Navigate to the Lambda dashboard at: https://console.aws.amazon.com/lambda/
- Select the Function you want to examine and visit its configuration page.
- Select the Configuration tab to view its setting panel.
- Click Monitoring and operating tools to view its settings.
- Select and enable the Enable Active Tracing. Traces will begin to be generated and captured whenever the function is called, allowing you to identify and address failures and exceptions, performance bottlenecks, and throttling.
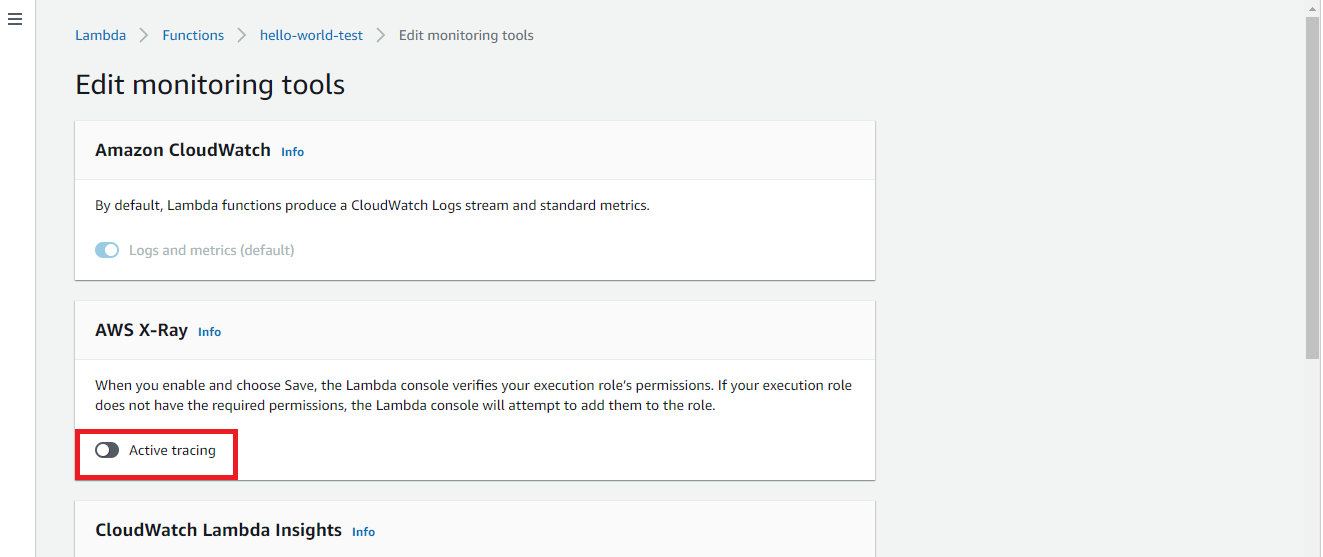
- Select Save from the dashboard top menu to apply the configured settings.
References: