
Risk Level: Low
Description
This module guarantees that logging and log cautions exist for firewall rule changes. Project Ownership is the most elevated level of honour on a task, any progressions in firewall rules ought to be intensely observed to forestall unapproved changes. The Filter to check is, resource.type="gce_firewall_rule"ANDjsonPayload.event_subtype="compute.firewalls.patch"ORjsonPayload.event_subtype="compute.firewalls.insert".
About the Service
Google Cloud Logging:
Cloud Logging is a fully managed service that allows you to store, search, analyze, monitor, and alert on logging data and events from Google Cloud and Amazon Web Services. Logging lets you read and write log entries, query your logs, and control how you route and use your logs. Log-based metrics are based on the content of log entries. For example, the metrics can record the number of log entries containing particular messages, or they can extract latency information reported in log entries. You can use log-based metrics in Cloud Monitoring charts and alerting policies. To know more about GCP Cloud Load Balancing click here.
Impact
System log-based metrics are calculated from included logs only. User-defined log-based metrics are calculated from both included and excluded logs. The data for a log-based metric comes from log entries received after a metric is created. A metric isn't retroactively populated with data from log entries that are already in Logging. This plugin ensures that logging and log alerts exist for firewall rule changes. Project Ownership is the highest level of privilege on a project, any changes in firewall rules should be heavily monitored to prevent unauthorized changes. Thus, the recommended action for this is to ensure that log alerts exist for firewall rule changes.
Steps to Reproduce
Using GCP Console-
In order to ensure or determine, if the logging and log alerts exist for vpc firewall rule changes, follow the steps mentioned below:
- Firstly, use the administrator account for signing up to Google Cloud Platform Console.
- Now, from the top navigation bar, select the GCP Project you want to investigate in.

- From the Navigation Menu on the left, you may find the Operations section.
- Click on the Logging subsection under Operations.
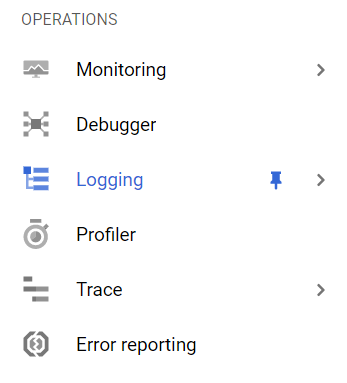
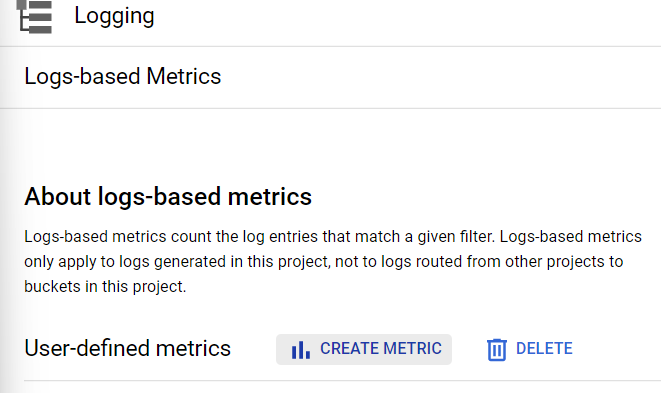
- Under the Logging navigation panel, you may find Logs-based Metrics as shown in the figure below.
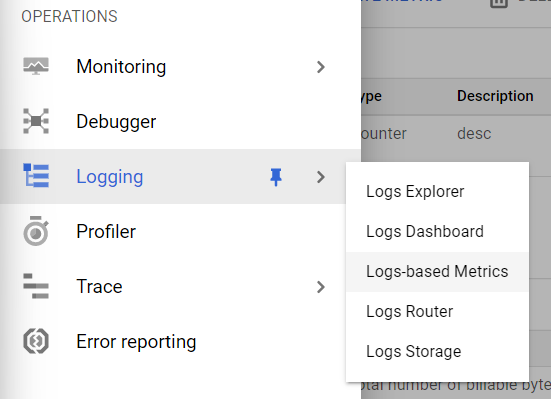
- Click on the Logs-based Metrics navigation link and a Logs-based Metrics Page will appear on the screen. Click to open directly from here.
- On the Logs-based Metrics Page, you will find the list of all the user-defined and system-defined metrics present within the Google Cloud Logging in your GCP Project.
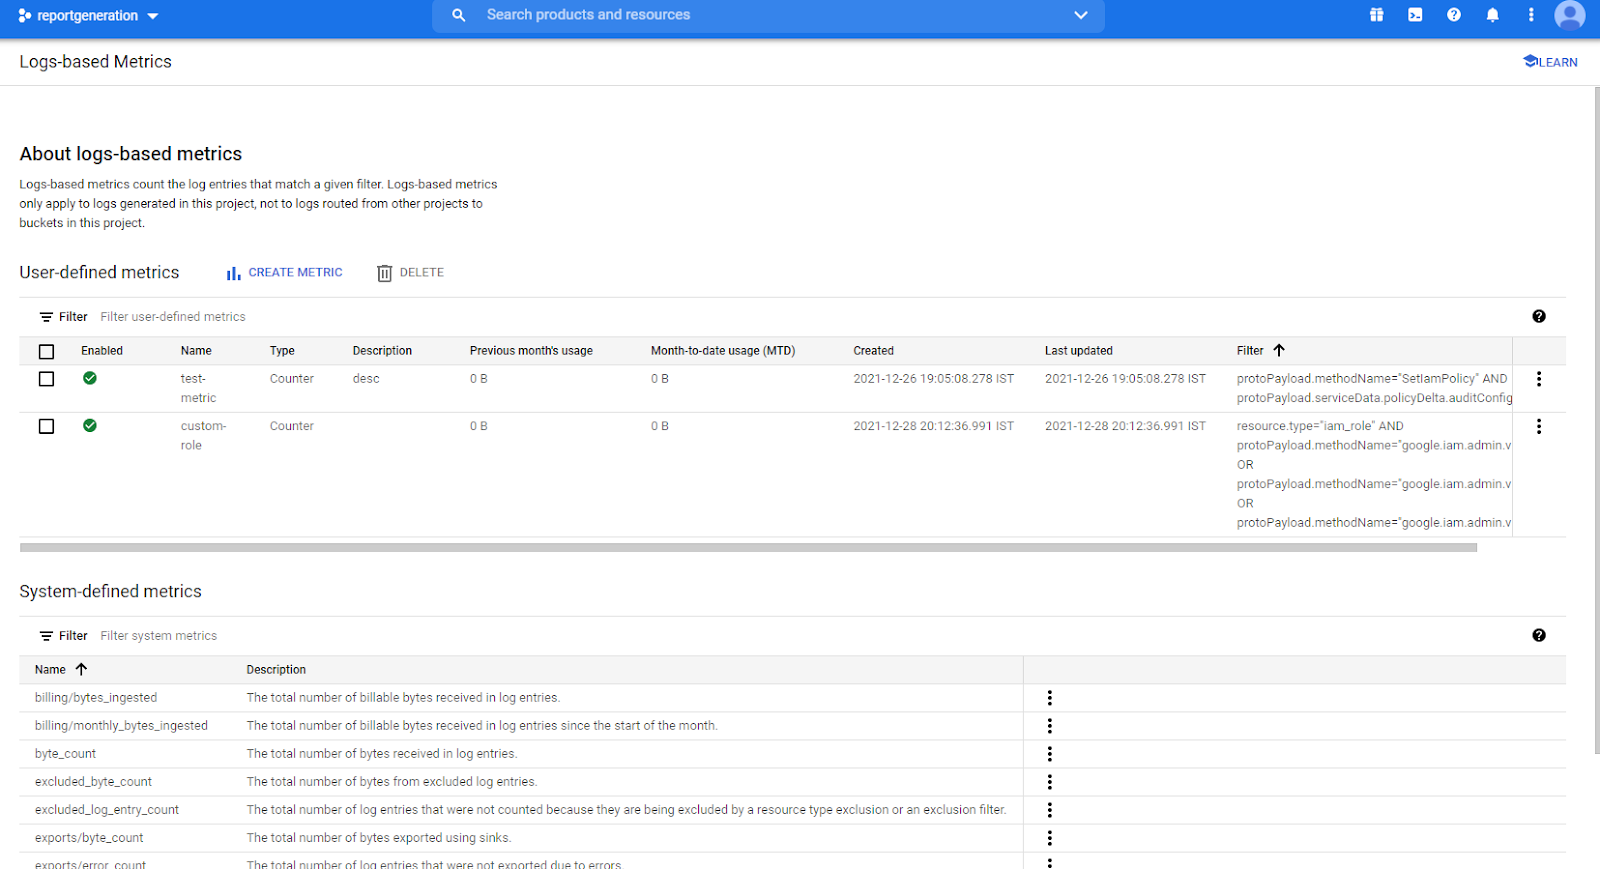
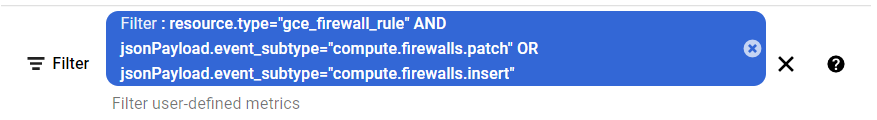
- Under the User-defined metrics and System-defined metrics sections, there is a Filter option. Type filter in it and set its value to the code mentioned below:
- Check if there is any metric for “VPC Firewall Rule Log”, by following step 8. If you find no such metrics then the logging and log alerts do not exist for VPC Firewall Rule Changes.
- You may repeat the above-mentioned steps to check for the other GCP projects/folders in your organization.
Steps for Remediation
Using GCP Console-
In order to enable the logging and log alerts for firewall rule changes, follow the steps mentioned below:
- Firstly, use the administrator account for signing up to Google Cloud Platform Console.
- Now, from the top navigation bar, select the GCP Project you want to investigate in.
- From the Navigation Menu on the left, you may find the Operations section.
- Click on the Logging subsection under Operations.
- Under the Logging navigation panel, you may find Logs-based Matrices as shown in the figure below.
- Click on the Logs-based Metrics navigation link and a Logs-based Metrics Page will appear on the screen. Click to open directly from here.
- On the Logs-based Metrics Page, you will find the list of all the user-defined and system-defined metrics present within the Google Cloud Logging in your GCP Project.
- As in the steps to reproduce, you found that metric does not exist. Thus, we will create it. Click on the Create Metric option available after the User-defined metrics, on the top navigation bar.
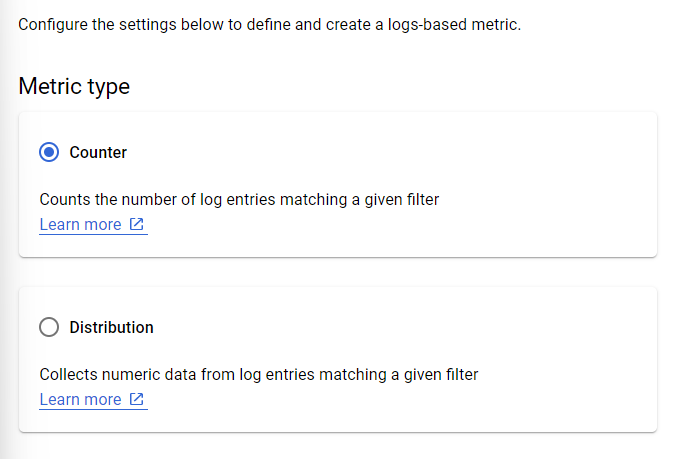
- A new page of Create logs metric will appear. Now, choose the Counter option under Metric type.
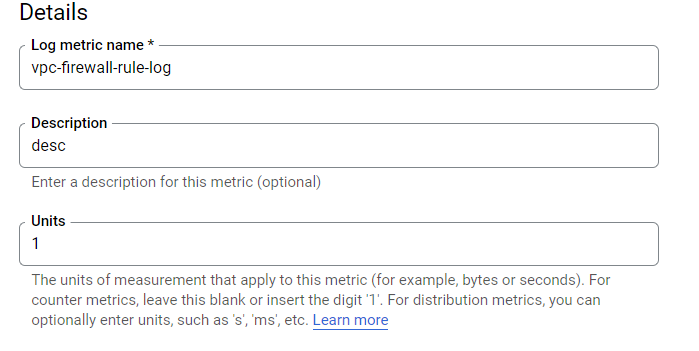
- Enter the Log metric name, description, and units details accordingly, under the Details section.
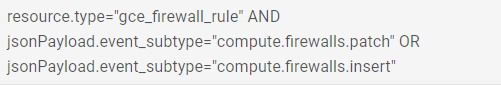
- Under the Filter selection section, write down the code in the Build Filter textbox. Code:
- resource.type="gce_firewall_rule" AND jsonPayload.event_subtype="compute.firewalls.patch" OR jsonPayload.event_subtype="compute.firewalls.insert"
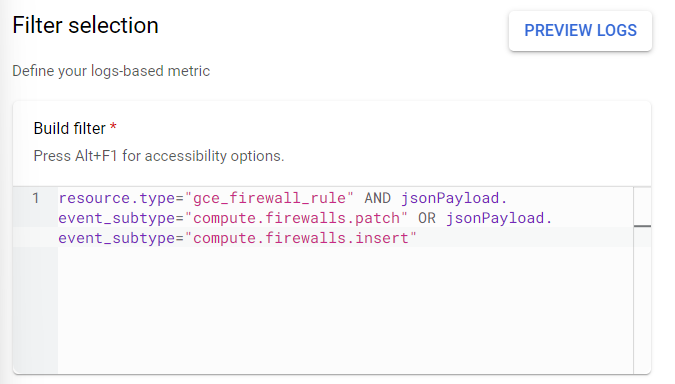
- Now, click on the Create Metric button present at the bottom to create the entered metric.
- Now, go back to the Logs-based Metrics Page. Under the user-defined metrics, you will find the metric name we have created just now. Click on the three dots icon available at the right of the matric bar. This will open up the available options to choose from.
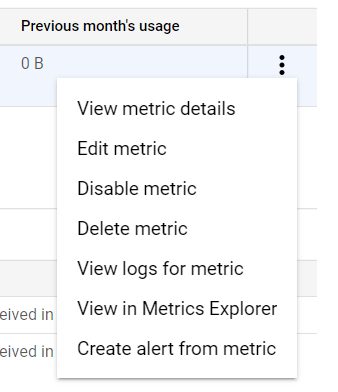
- Click on the Create alert from metric option. A Create alerting policy page will appear. Click on the Add Condition button present in step 1.
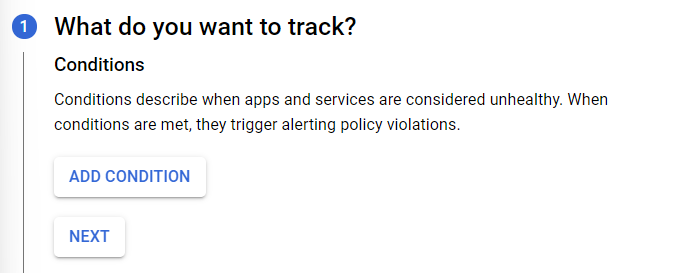
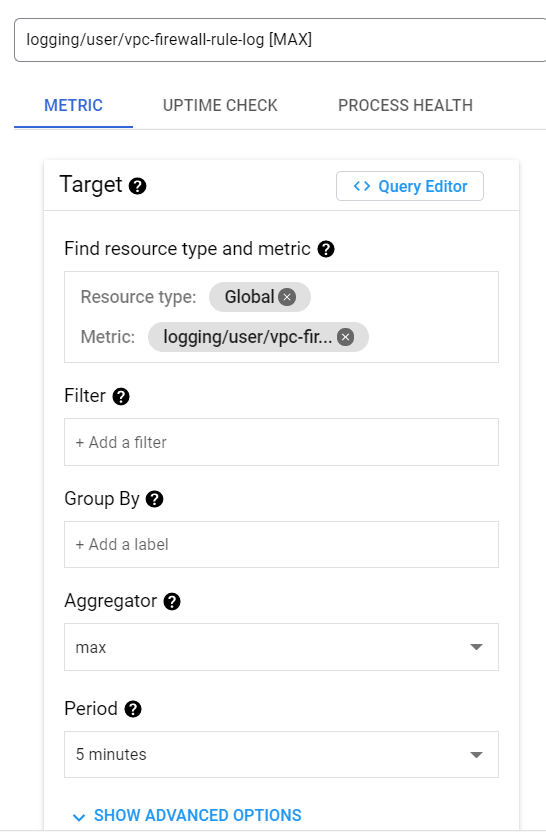
- Choose the Resource Type according to your preference. Now, choose the Metric Name which we have created just now. Fill in the other required details. Choose max in Aggregator and Period as 5 minutes (this may vary accordingly).
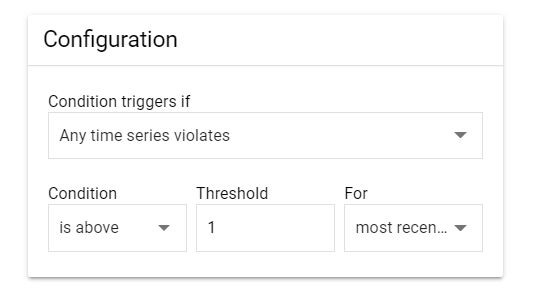
- Select the "Configuration" from the dropdown menu accordingly. Now, enter the "Condition, Threshold and Minute" of the above "Configuration" accordingly.
- Click on the Add button to save the changes. This will enable the logging and log alerts for firewall rule changes.
- You may repeat the above-mentioned steps to check for the other GCP projects/folders in your organization.